Solar flares and coronal mass ejections hurl a tremendous amount of energy into the solar system. Some of that energy gets coupled into the electromagnetic system that surrounds Earth. The most visible aspect of this is the beautiful dancing light displays in the sky at northern latitudes known as the aurora borealis, or the northern lights. Solar flares can impact everything from air traffic patterns for airplanes to GPS signals, to the amount of potential radiation exposure for astronauts as they are traveling in space.
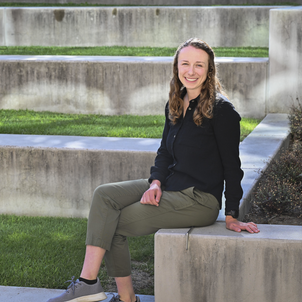
In my research, I analyze data to understand and ultimately predict these disturbances in the Earth’s upper atmosphere. The data are collected from scientific instruments operating on the ground as well as on satellites orbiting the Earth. I look at data from magnetometers, radio wave receivers, particle detectors, imagers and more. My job is to formulate scientific questions and use large volumes of data to find patterns and relationships within the data to support (or refute) a hypothesis. I love tackling new data sets and using data to ‘see’ what is happening in space.
Earlier this year, I participated in a datathon hosted by the Institute for Computational & Mathematical Engineering (ICME). For someone who likes to work with data, these challenges are super fun. As a part of the competition, you are presented with a data set on a completely random topic and given a specific task. The challenge is to build the best possible statistical model, and the team with the most accurate model wins! My team (of one) did not win, but I always learn something new when participating in a data challenge. It pushes me to sharpen my skills in data wrangling and experiment with new machine learning algorithms.
Related spotlights

Dan Somen

Sonia Martin


